The need to optimize KLA performance may come from different execution scenarios:
- a local single user (using KLA GUI) analyzing an application that does not finish successfully or demands a very high amount of resources (in terms of memory and/or execution time)
- a continuous integration system where local analysis is part of the build process and needs a very fast performance on analysis, thus avoiding unneeded blocking waiting periods.
There are two ways to configure the KLA to optimize performance:
- Optimize the Content and the Scope of the Analysis with Kiuwan Local Analyzer
- Optimize your Local Machine for the Kiuwan Local Analyzer
Optimize the Content and the Scope of the Analysis with Kiuwan Local Analyzer
Select the right source code to analyze
Before you start an analysis with KLA, you have to provide a source code directory. All the files available in this directory will be analyzed. The size of the source code to be analyzed affects proportionally the time and memory used for the analysis execution.
Avoiding analyzing unneeded code is the first approach to reduce time and memory.
See our guide on Setting Source Code Filters with KLA.
Execute a ruleset according to your needs
By default, the rules analysis steps execute all of the model's active rules for every file.
The default model (CQM) contains approx 900 rules, of which 700 are active. This means that for every file, 700 rules will be executed on their source code.
Choose a model that suits your needs the most, activating only the rules that are important to you.
A large set of rules will generate defects for high-priority rules as well as for low-priority ones.
Mute or deactivate a rule
Rules can be either muted or deactivated.
Muting a rule means that the rule will still be executed in the background, however, the results will be hidden (e.g. in the event of many false positives)
Deactivating a rule means that the rule will not be executed at all (e.g. found defects are uninteresting or do not apply to your application). Deactivating rules speeds up the analysis process and makes it more manageable.
Process JSP in Java analyses
If you are analyzing Java, there’s a configuration option that has a considerable impact on analysis performance and memory needs:
- process JSP as Java servlets?
If this option is set to true (the default value), for every JSP Kiuwan will internally generate its Java servlet code and will execute the Java rules to it.
This servlet code generation consumes a considerable amount of time and memory.
The advantage of generating it is a higher precision in detecting Code Security vulnerabilities spread between JSPs and Java files (mainly XSS).
If this is not your concern, you can set this property to false and the execution will be faster and will run with less memory needs.
Pay attention to ambiguous file extensions
- .sql matches PL_SQL, Transact and Informix,
- .c/.h matches C, C++ and Objective-C
GUI mode: KLA detects such ambiguous situations and asks the user to select the correct technology.
CLI mode: KLA will execute by default every available engine, wasting time and resources producing confusing results. To solve this, search for the supported.technologies parameter when invoking KLA in CLI mode and delete the unneeded technologies.
Duplicated code analysis
Duplicated code analysis (aka clone detection) is also quite an intensive memory and CPU-draining task.
However, it can be configured to modify its working mode, reducing time and memory requirements.
Kiuwan’s clone detector searches for fragments of tokens that are very similar.
The term ‘token’ refers to each of the atomic elements identified by the analyzer. There are three types of tokens:
- Operators and reserved words (specific for each language)
- Identifiers: variable names, function names, etc.
- Literals: numbers and string constants used in the code.
Kiuwan also generates defects of ‘duplicated code’ according to the size of the fragments found:
You can configure the minimum tokens that Kiuwan uses to detect a clone. This is done at two levels:
- In Kiuwan’s Local Analyzer go to Advanced options, then configure the number of tokens to detect a clone. You can configure a different number of clones for each language
- In your model, configure the minimum tokens to generate a ‘Duplicated code’ defec
Depending on this configuration, Kiuwan gets different results in the clone detection. Let's see these in detail.
The most conservative way
In this case, we configure Kiuwan to look for an exact match between the different fragments:
{language}.min.tokens=20
{language}.ignore.literals=false
{language}.ignore.identifiers=false
Take this source code as an example:
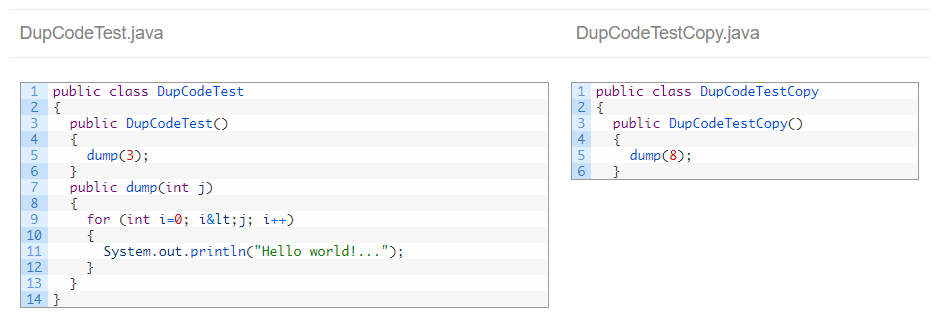
Kiuwan detects duplicate code
The detected tokens are:
Set the clone detector to be smarter
Now we are going to configure Kiuwan to ignore the numbers and string constants in our code:
{language}.min.tokens=20
{language}.ignore.literals=true
{language}.ignore.identifiers=false
As you can see in the picture above, now the fragment is bigger because the literals (‘3’ and ‘8’) are not taken into account.
The third option
As the third option, we can ignore literals and identifiers:
{language}.min.tokens=20
{language}.ignore.literals=true
{language}.ignore.identifiers=true
With this last option, the most efficient one, it was clear that the class DupCodeTestCopy is a copy-paste where the class was only renamed, so Kiuwan detects the whole class as a clone.
But this configuration is also the one most prone to false positives. For example:
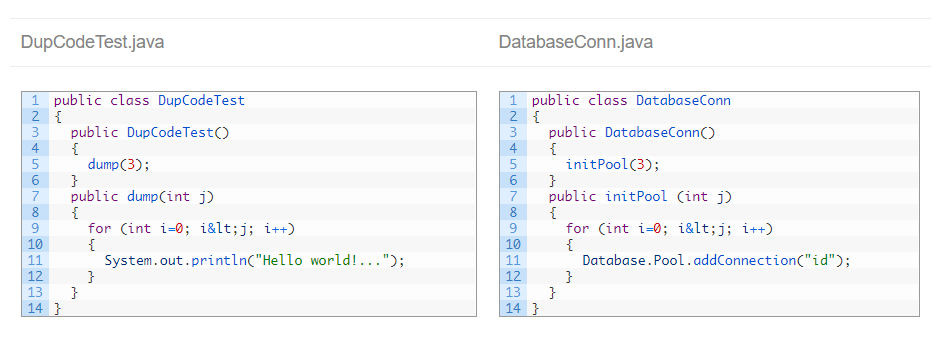 Both files have a similar structure, but functionally they are very different. Ignoring literals and identifiers, Kiuwan considers both a clone.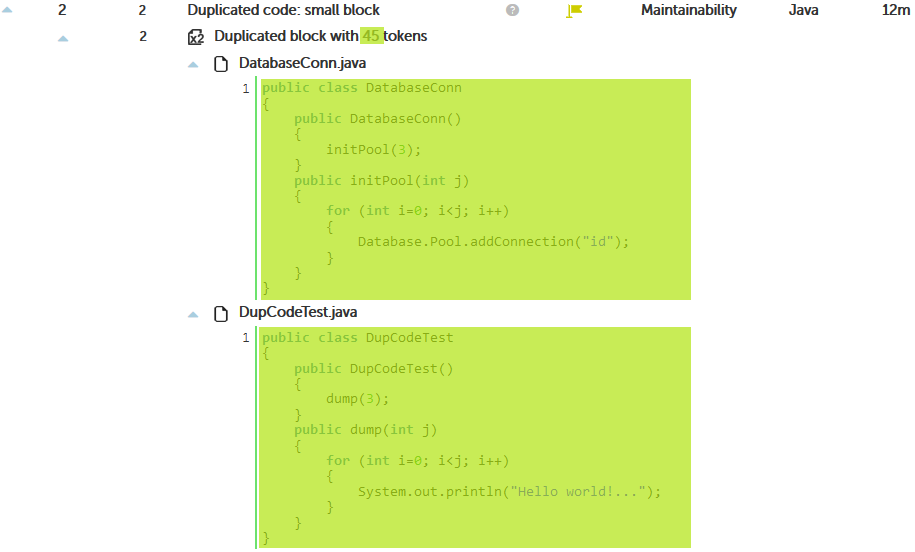
Optimize your Local Machine for the Kiuwan Local Analyzer
Here are some things you should consider to properly configure your analyses.
Optimize the Java Virtual Machine
By default, KLA comes with pre-configured default values:
- max memory to use during every single step
- max duration time (timeout) of every single step
These parameters are configured through the KLA configuration mechanism, please do not modify KLA scripts to include JVM flags such as -Xmx, use the mechanisms Kiuwan provides.
Single and parallel execution of analyses
Every step in an analysis with the KLA is executed sequentially, following the order below:
- For each technology
- rule analysis
- metrics analysis
- clone detection
- Report generation, encryption, and uploading to Kiuwan cloud
Every step is executed by a “new” JVM (Java 8 or above required) and the Kiuwan configuration applies to all of those JVM instances. If your source code contains more than one technology, it will execute each step for each technology.
If the machine running KLA analyses contains more available CPUs, you can run parallel analyses by executing additional instances of KLA.
In a parallel KLA execution scenario, every running analysis is completely independent of each other, so you can execute multiple analyses provided your machine has enough CPUs.
Memory configuration
By default, the KLA comes preconfigured with the following memory default values (analyzer.properties):
# Starting size for heap memory (128m = 128 Megabytes)
memory.start=128m
# Maximum size for heap memory (1024m = 1 Gigabyte)
memory.max=1024m
# Stack memory, per thread (1024k = 1 Megabyte)
stack.size=2048k
If your local analysis ends with an Out of Memory (OOM) error, you need to increase the max memory allocated to the JVM (by default, 1GB).
The troubleshooting links below can help you identify OOM errors:
You can configure Kiuwan to increase memory limits either for the whole installation or per application.
If you notice the process is performing a high activity of JVM garbage collection, even without an OOM, this situation may indicate your analysis needs more memory and the performance is suffering due to GC activity. In this case, try to increase the max memory, most probably the analysis performance will be faster.
Timeout configuration
By default, every step of a local analysis is configured to a default max execution time (60 minutes) (analyzer.properties):
# Timeout to use for max execution time of each analysis step (in msecs)
timeout=3600000
The default value is often enough for most analyses, but depending on several circumstances (code size, memory, ruleset, etc) could not be enough, and a timeout error occurs (Timeout Killed the Subprocess).
If this happens, increase the default value.